Chat case
AI for presentations: send a spreadsheet, get a quarterly report deck for the owner

A quarterly report is mostly arithmetic and judgement; the slides are the slow part. We gave our test agent a raw export from a small coffee roastery and asked for a deck the owner can read on Monday. Three messages produced a nine-slide PowerPoint file with native charts, a shorter slide and a new cost chart on request, speaker notes and a one-minute summary to say out loud. Below are the real replies, the slides, the cost and the one message worth sending before the deck goes to the owner.
The short answer
Send the agent the raw numbers as they are: an Excel export, a CSV, a screenshot of a table. Say who will read the deck, how many slides, and ask it to explain anything unusual in the data. You get a presentation file with charts and a short written verdict in the chat.
Then edit it the way you would brief a colleague: “slide 3 is too long”, “add a chart of costs”. When the content is right, ask for speaker notes and a one-minute version you can say out loud.
The agent does the arithmetic and the first draft of the story. You add what only you know about the business, and one last message has the agent check every claim against the file before the deck goes out; more on that below.
The test: a coffee roastery and one quarter of raw numbers
We built the data ourselves. A coffee roastery with 14 people sells to cafés, through its own online shop, to offices on subscription and on a marketplace. The Excel file has six tabs: revenue by month and channel, nine cost lines, headcount, six KPIs, the Q2 totals and four dated notes. It looks the way an operations manager's export usually looks: no formulas, no charts, no summary.
We also planted a few things an owner would want to hear about: a marketplace sale in August, a café chain that left mid-quarter, a courier price rise in September and a new hire. The company is made up. The answers are real: everything below was sent to our test agent on 29 October 2026, in one chat.
Step 1. Send the numbers and say who the deck is for
“Make a presentation” gets slides. “For the owner, numbers first, explain anything unusual” gets a report. The slide count keeps it short enough to read before a call.
The file came 2 minutes 39 seconds after the message. A .pptx opens in PowerPoint and Keynote, and Google Slides imports it. Ask for the same deck “in Google Slides” and you get a link to it in your Drive instead.
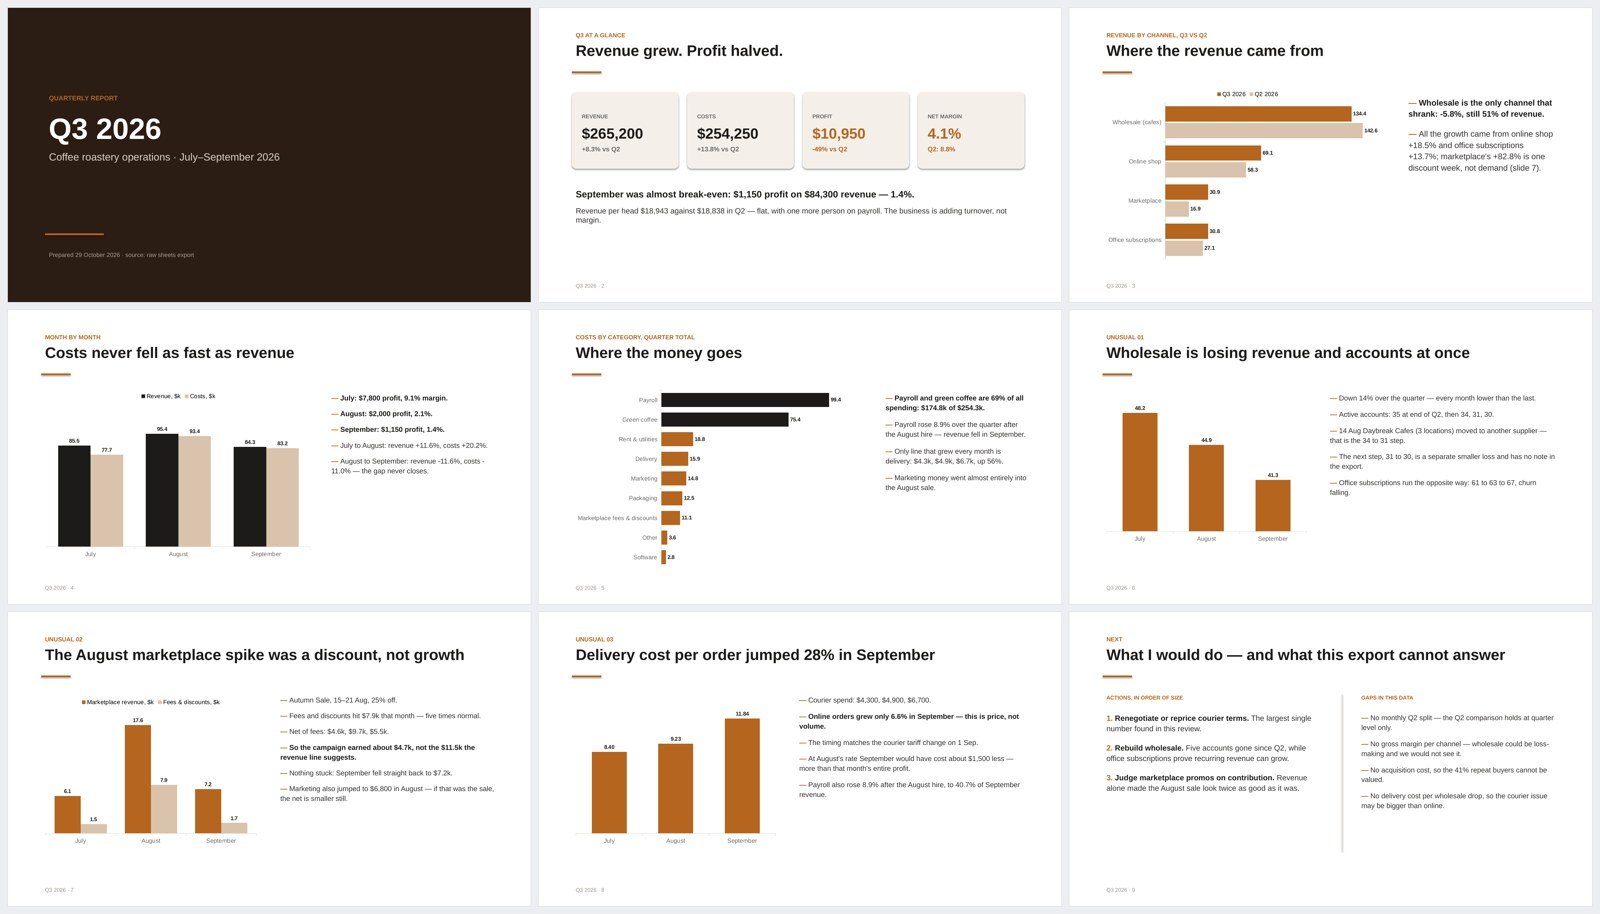
The eight slides follow the brief: a title, one slide with the four totals, revenue by channel against Q2, revenue and costs month by month, three slides on what looks unusual, and a closing slide with actions and a list of what this export cannot answer. Each of the five charts is a real chart object, so you can change it in PowerPoint without rebuilding the slide.
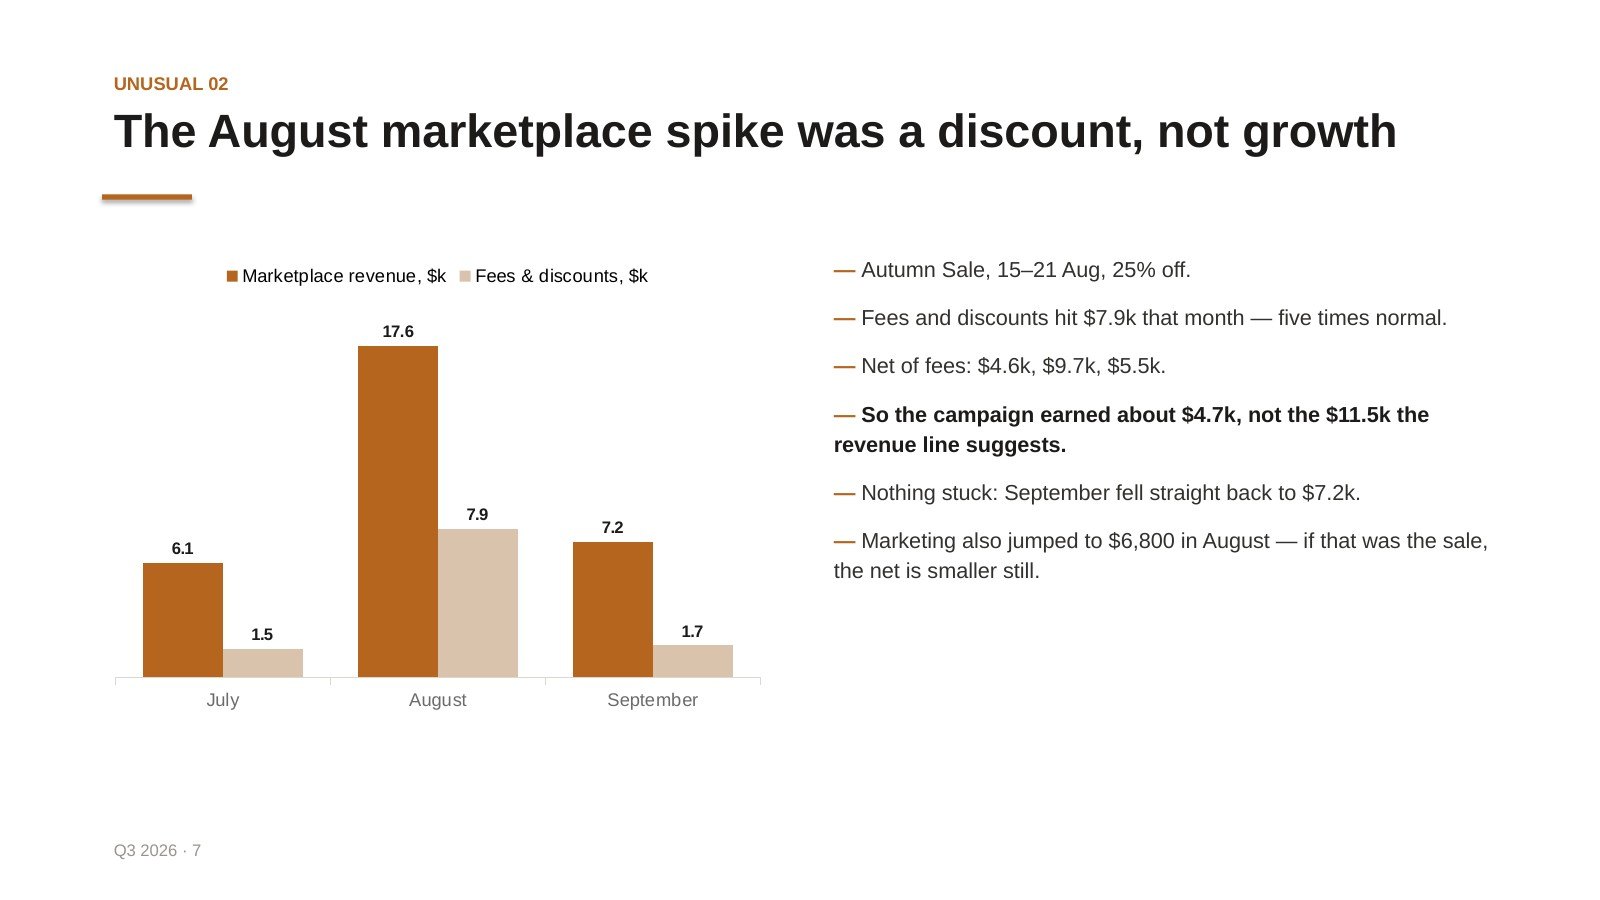
The analysis went further than the brief. The agent checked that orders times average order matched the revenue line before trusting the file. It connected the notes tab to the numbers: Daybreak Cafes explains the drop in August, the courier tariff explains September. And it found a loss we had not explained anywhere, one more wholesale account in September, and said there was no note for it instead of inventing a reason.
Step 2. Edit it like a colleague's draft
The first version was good, with one slide carrying four bullet points and nothing on where the money goes. Owners ask that question first, so we asked for both changes in one message.
74 seconds. The agent did not just delete two bullets: it moved the comparison into the chart, so the slide lost words and kept the information. Here is slide 3 before and after.
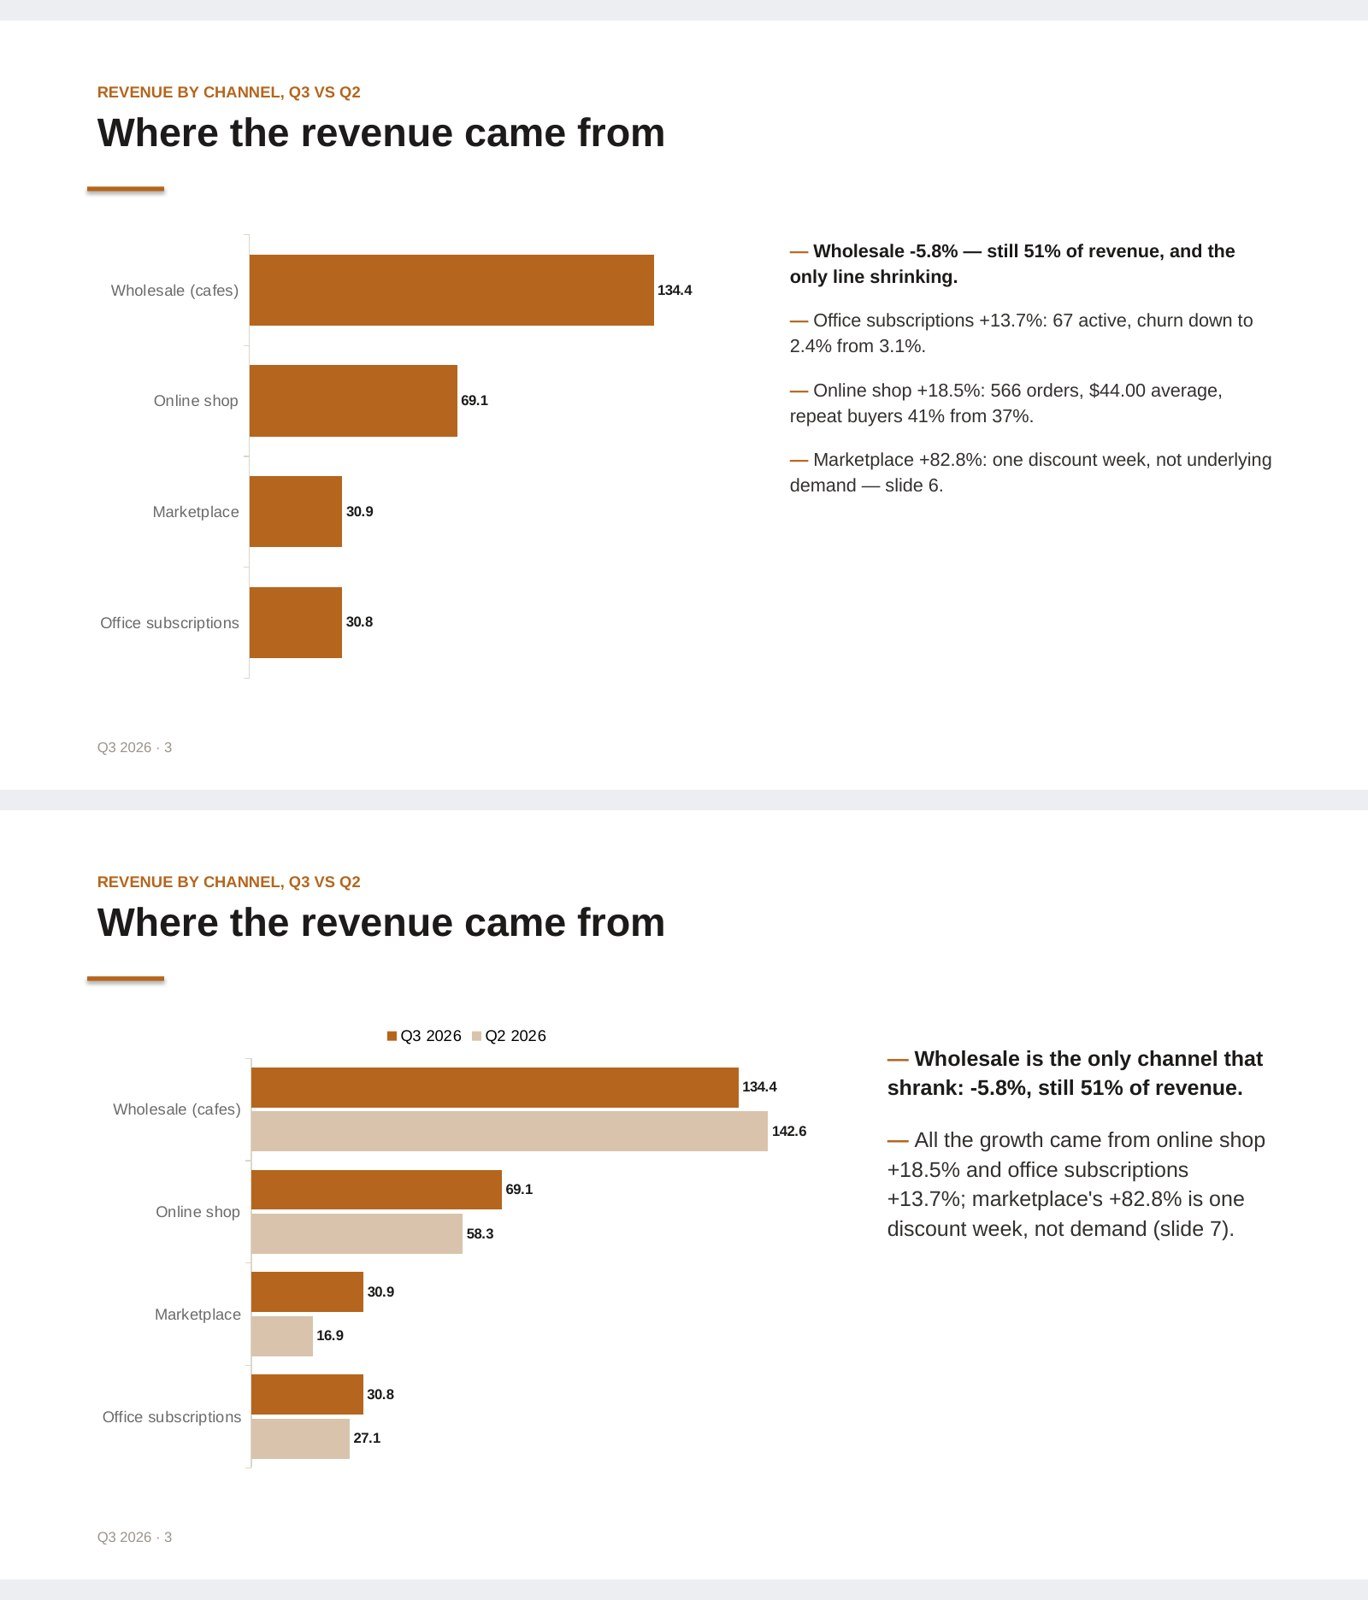
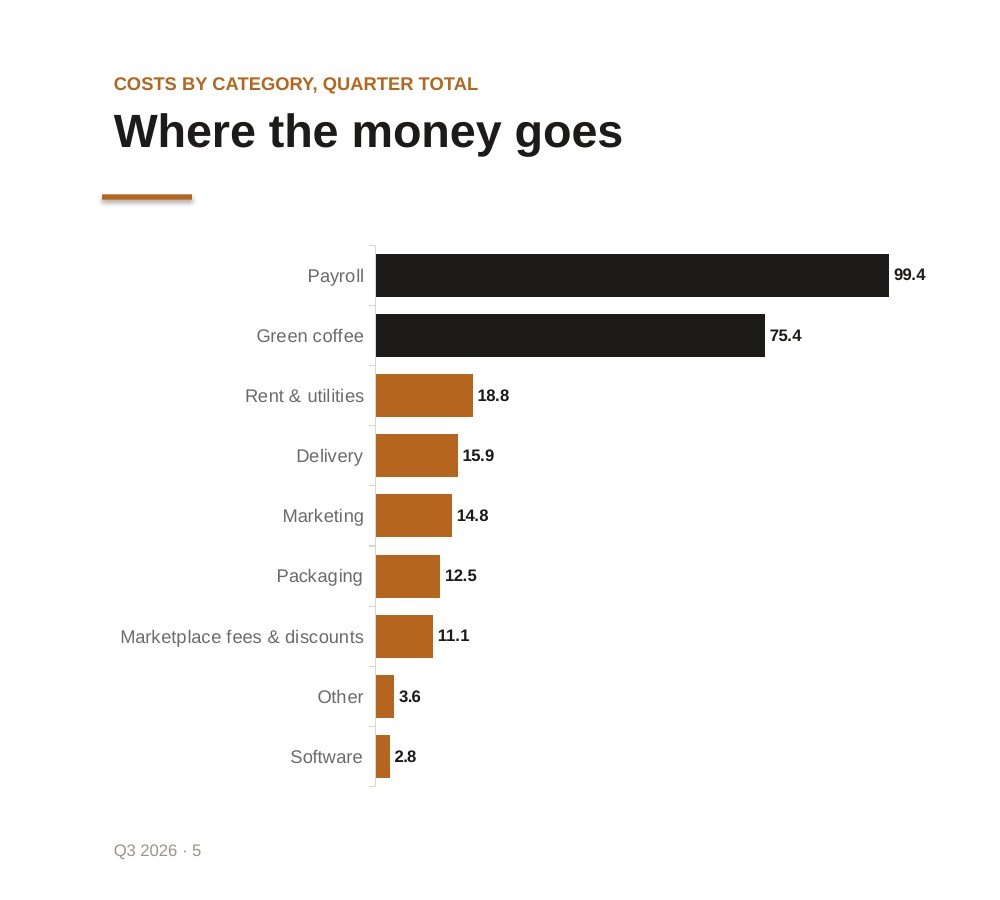
The new cost slide sorts nine lines from largest to smallest and highlights the two that make up 69% of spending. Every total matches the source file.
Step 3. Speaker notes and a one-minute version
A deck for the owner usually gets presented on a call, and the first minute matters most. Ask for both in one message.
21 seconds. We opened the file and found notes on all nine slides. They add what the slide does not say: “Do not defend the marketplace number here; say it is one discount week and point to the later slide.” On the wholesale slide the note says to ask the owner about the unexplained account instead of guessing.
Before you send it
Every total in the deck matched the source file, and the agent listed the limits of the data on its own closing slide, for example that courier spend sits in one line for café and online deliveries. One habit makes a deck like this ready for the owner: as the last step, ask the agent to “check every claim on the slides against the file and list anything that does not hold”. It takes one message and a minute.
A tip for the spoken summary: if you want every figure on the same basis, say so, for example “compare everything with Q2”. Then the owner hears each number against the same period.
Your chat history, with the figures you send, stays in your agent's isolated container. To answer, the agent sends requests to the model: on the default model they go through DeepSeek's infrastructure in the People's Republic of China, which you confirm during onboarding, and on Pro you can attach your own Claude or Codex, so requests go to that provider under your own account. More in Is an AI agent safe? 8 things to check before you let one into your chats.
What it costs
We read the balance in the agent's status line after each message. The first deck cost 9 , the two edits 2 and the notes with the summary 1 : 12 for the whole case, a little over four minutes of waiting in total.
Text work on the default model costs 1 per 20,000 tokens. The Free plan gives 200 in the first month and 100 every month after, with no card. Pro costs $13.90 a month for 400 , or $1.39 for the first month if you subscribe within 7 days of signing up. All rates are on the pricing page.
The same chat handles the documents around the report. To pull figures out of a PDF before they reach a spreadsheet, see Twelve things to ask an AI about a PDF. For contracts and invoices, see AI for documents: send a contract, get the risky clauses, then check the invoice against it.
Messages worth copying
Here is our quarter export. Make a report deck for the owner: 6–8 slides, numbers first, explain anything unusual in the data. Send a .pptx.
Before you build the slides, check that the totals in this file add up and tell me if anything does not match.
Make slide 3 shorter, two points at most, and move the comparison into the chart.
Add a slide with our costs by category for the quarter, largest first.
Add speaker notes to every slide, two or three sentences, and give me a one-minute summary to say out loud.
Check every claim on the slides against the file and list anything that does not hold.
Create your agent, send it the next export the day the quarter closes, and keep the edits in the same chat.
Try it with your own agent
Free, no card. The agent starts working in the chat straight away.
Create your AI agentQuestions
Can an AI agent make a presentation from a spreadsheet?
Yes. Send the file, say who the deck is for and how many slides you want. In our test the agent read a six-tab Excel export, checked that the figures added up and sent an eight-slide PowerPoint file with five native charts in 2 minutes 39 seconds.
Can it make Google Slides?
Yes. Connect Google once: the Guide lists Slides among the Google services you connect with one link. Then ask for the deck in Google Slides, and the agent creates it in your Drive and sends you a link. In our test we asked for a .pptx file, and Google Slides imports that too.
Are the charts pictures or real charts?
Real chart objects. The file contains five charts in the first version and six after the edit, so you can click one, change a colour or fix a number in PowerPoint without rebuilding the slide.
Can I edit the deck in the chat?
Yes. We asked to make slide 3 shorter and add a chart of costs by category. The agent cut the slide to two points, moved the Q2 comparison into the chart and added a new cost slide, all in 74 seconds.
Can I trust the numbers?
Yes, and the agent checks them itself. In our test every total matched the source, and the agent flagged the gaps in the data on its own. Before you send the deck, ask it to check every claim on the slides against the file: one more message, and a good habit for any figures that go to an owner.
How much does it cost?
Our three exchanges cost 12 in total: 9 for the first deck, 2 for the edits and 1 for the notes. The Free plan gives 200 in the first month and 100 every month after, with no card.